

Computer Vision in Oncology: Decoding Lung Cancer Data from Images to Genetics
Case Study


The Challenge: Connecting the Visual to the Molecular
Lung cancer research generates a large volume of data, broadly falling into two categories: the molecular (genomic sequencing or "omics" data) and the physical (high-resolution microscopic images of tissue, known as histopathology slides).
Traditionally, these datasets have been analyzed separately. The core challenge our data scientist tackled was integration: determining whether the physical, visual characteristics of a tumor cell can reliably predict its underlying genetic mutations and the patient's prognosis.
To evaluate this at scale, the project analyzed a robust dataset from The Cancer Genome Atlas Lung Adenocarcinoma (TCGA-LUAD) project. The study processed 90 high-resolution histopathology slide images covering 63 distinct patients. This visual data was then cross-referenced against 1,149 Copy Number Variation (CNV) genetic files spanning 518 patients, alongside clinical data from 585 patients. While the wider dataset included hundreds of clinical and genetic records, the machine learning models were specifically trained and validated on the intersecting subset of 63 patients who possessed all three critical data types: visual, genetic, and clinical.
To address this, our team utilized a machine learning architecture known as a Convolutional Autoencoder.
For chemists or engineers, an autoencoder operates similarly to a chemical distillation process or a signal compression algorithm. When a detailed microscopic image is fed into this model, the data is forced through a computational "bottleneck." To fit the image through this narrow bottleneck, the model strips away background noise and retains only the most defining structural features of the cell.
The output is a compressed mathematical representation of the image—a unique "data fingerprint" (referred to as latent features in machine learning terminology). This approach allows the algorithm to automatically identify and quantify complex microscopic patterns in the cell structure, translating biological visual data into analyzable numeric variables.
In the landscape of precision medicine, the ability to extract actionable insights from multi-modal datasets is changing how we understand and treat complex diseases. For research and development teams, biochemists, and engineers, bridging the gap between different types of scientific data is a key component of accelerating discovery.
At our data science consulting firm, we focus on translating computational techniques into laboratory and clinical applications. Today, we are highlighting a case study based on a past project conducted by one of our data scientists. This work, focusing on the integration of genetic data with medical imagery in lung cancer patients, illustrates how Computer Vision is being applied in oncology.
The Technology: Translating Images into "Data Fingerprints"


For leading translational research centers focused on bridging the gap between molecular biology and clinical application, integrating multi-omics data is one of the frontiers of personalized medicine. This case study demonstrates how unsupervised machine learning and Computer Vision can transform standard histopathology into a deeply predictive molecular tool.
By implementing similar custom AI pipelines, research teams can accelerate their workflows in several critical areas:
Accelerated Biomarker Discovery: Moving beyond single-gene analyses to discover complex, multi-modal biomarkers by linking latent morphological features directly to genomic instability and specific compound responses.
Enhancing Multi-Omics Integration: Seamlessly integrating standard clinical imaging into multi-omics platforms, allowing researchers to rapidly generate molecular hypotheses before conducting resource-intensive wet-lab sequencing.
Stratification for Clinical Trials: Developing highly sensitive, AI-driven prognostic models that can better stratify patient populations for targeted therapies based on early-stage, image-derived phenotypes.
Whether you are working to decode microscopic imagery, integrate complex chemical datasets, or refine multi-omics pipelines, our team has the expertise to build the advanced computational frameworks necessary to drive your next translational breakthrough.


Applications for Your Pipeline
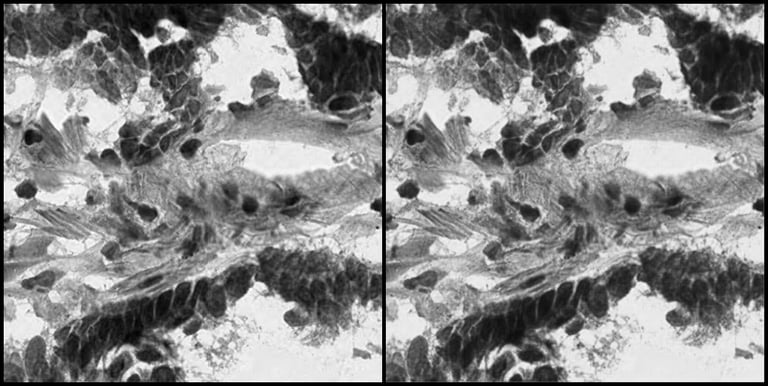
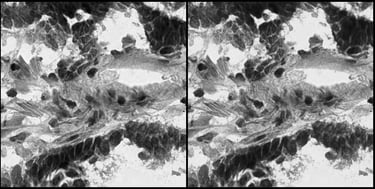
Side-by-side comparison of the Original Histopathology Image and the Reconstructed Image by the Autoencoder Model.
To understand how effectively the autoencoder captures the biological reality of a tumor cell, we can look at the model's inputs and outputs. On the left side of the image is the original histopathology slide tile, containing highly complex cellular morphologies. On the right is the image reconstructed by the AI after the data has been compressed into the most important data features. The best-performing autoencoder model in this study achieved a Mean Squared Error (MSE) reconstruction error of just 0.43%. This low error rate, along with the visual reconstruction demonstrate that the mathematical "fingerprints" the AI extracts are not losing critical biological information—they retain the exact structural features needed for accurate downstream analysis.
Once these visual data fingerprints were extracted, they were tested against the patients' actual genetic data and health outcomes. To bridge the gap between data science methodology and laboratory application, here is a breakdown of the results from both perspectives:
1. Survival Prediction Modeling
The Machine Learning Perspective: By utilizing the compressed features extracted from the histopathology slides as input variables, a Random Forest classifier was trained to predict the vital status of patients (alive or deceased). The model achieved an AUROC (Area Under the Receiver Operating Characteristic curve) score of 99.36% on an independent test dataset.
What it Means for R&D: The AUROC metric measures how well a model can distinguish between different categories. An AUROC of 99.36% indicates that by feeding these visual "cell fingerprints" into the predictive algorithm, the model was able to accurately forecast a patient's survival based solely on the microscopic structure of their tumor cells.
2. Correlating Images with Patient Outcomes
The Machine Learning Perspective: The project quantified the relationship between the compressed image data and clinical outcomes, determining that 1,852 out of the 2,048 identified compressed features (90.43%) were statistically significantly correlated with the vital status of patients at follow-up.
What it Means for R&D: The data shows that over 90% of the unique visual characteristics identified by the autoencoder had a direct, measurable link to the patients' long-term health indicators (vital status). This indicates that physical cell morphology holds quantifiable prognostic information.
3. Mapping Visual Features to DNA
The Machine Learning Perspective: The study mapped visual features to DNA Copy Number Variations (CNV). A dedicated neural network regression model predicted CNV feature segment means from compressed image features alone, attaining a Mean Squared Error (MSE) of 1.48% on an independent test dataset.
What it Means for R&D: The model predicted specific genetic variations by analyzing the cell's physical structure. An MSE of 1.48% indicates a low error rate, meaning the algorithm's visual-based predictions aligned very closely with the actual, lab-tested genetic sequencing results.
Key Findings and Impact

Contact Us
Have questions or want to chat about the project?
Driving Efficiency, Competitiveness, and Sustainability with industrial analytics.
Contact
Updates
+49 176 21044135
© 2025-2026. All rights reserved.
Machinalytics